Frequently Asked Questions
WEB Layers
It seems there is a misalignment or a missing button
The screen configuration has limited dynamic adaptation capabilities at the moment. For this reason, you may be able to see everything correctly by simply zooming out.
Map viewer
Geometries
Am I making a mistake by drawing geometries from the viewer?
The Layers Web background map (on which the geometry is drawn) has a resolution between 0.1 and 0.15 m/px, so that is the error that can be made when digitizing from the viewer.
The error made in measurements in Layers Web is that of the document supporting the cartography, in this case the images. If we measure or define a geometry on satellite images, the error will be greater than if we do it on a drone flight. And the zoom level we are using is important to avoid interpretation errors. When you define a line on an image with 50cm per pixel resolution, the error you can make is plus or minus that value in each measurement, some by excess and others by default. The combination of these errors should be considered quadratically and estimate the excess or defect of surface area it may mean. In any case, these are values that deviate very little from reality.
What is measured in Layers Web is the same as what can be measured with Qgis or ArcGis, if the same area is marked.
Regarding the measurement of areas with slopes, the slope is never taken into account for measuring a surface area. The surface measurement is always on the orthophoto, which is a document without elevation (an orthophoto is like a map, only X and Y). The surface area depends on the projection being used.
Satellite
It seems that in two consecutive satellite dates I see EXACTLY the same thing, is that possible?
We have detected that on very rare occasions, the European Space Agency system responsible for pre-processing Sentinel 2 information has some problems that it cannot detect. On these occasions, it sends Layers the last available information, and therefore the user sees the same information from the last pass. Unfortunately, in these cases, it is not possible to recover the image.
Can satellite pass dates change?
It takes 5 days to pass twice over the same point under the same conditions, but this doesn’t mean that in the ‘overlap’ between passes, both lateral (sidelap) and consecutive (overlap), it cannot pass several times over the same spot. In fact, we can record up to 4 images during this 5-day period.
This is what happens worldwide, and to avoid user confusion, we set a limit to show only one date every 5 days. This restriction means that the date shown in the viewer may change, but it’s not an error since the satellite did indeed fly over this plot on that day.
The satellite image appears to be the same on two consecutive dates
This is a known issue: sometimes, when less than 24 hours have passed since the actual satellite pass, the satellite information query system sends the last available image by default. This means that information from the last satellite pass is displayed on the query date. The solution to this problem is to wait a few hours until the correct image is available.
The satellite image appears very different on two consecutive dates
When we have cirrus clouds, which are not detected as normal clouds, the satellite image can vary between consecutive dates. These clouds can be observed in the RGB layer.

RGB with cirrus clouds / RGB without cirrus clouds (5 days difference)
The layer I’m viewing doesn’t match the image text (e.g., NDVI in a radar satellite pass)
Sometimes users have reported layers that randomly change names. This problem is related to the use of ‘Google Translate’ in the browser. To disable it, in the URL bar (next to the favorites star in Chrome), click on the three dots and select never translate layers.
I don’t see the entire soil texture layer
The soil layer is only available when there is no vegetation, that is, when the NDVI is low.


Why do fields disappear when I change the satellite date in a field selection?
In field groupings, all flight dates are shown for all selected fields. If in the same selection there are fields with passes on different dates, we will see fields appear and disappear from the map as we change the date, this happens because only the available fields will be shown for each date.
Are NDMI and LWS the same or similar?
No, NDMI measures vegetation moisture, and a low NDMI level may or may not indicate stress. It’s not stress if the crop is underdeveloped, but it is stress if the crop is well developed and the moisture level doesn’t correspond to the crop size. Therefore, NDMI shows moisture, but you don’t know if that moisture level indicates water stress or not, while LWS tells you whether it’s stressed or not.
Example 1:
When analyzing an olive grove plot, two different crop varieties showed very unequal water status according to NDMI. Our agronomy team attributed this to the different vigor between them, and since the index measures plant moisture, the more vigorous variety would also show higher moisture levels, which did not imply that it suffered less water stress. LWS, in addition to evaluating vegetation moisture level, considers its vigor, detecting the same stress level between both varieties. LWS (Layer Water Stress) allowed us to detect water stress regardless of the plant’s vigor level, now both varieties can be evaluated directly.

Example 2:
The first image shows a tomato crop, where NDVI shows different values due to different transplant dates. In the second image, we apply NDMI and see almost the entire crop in red or orange (low moisture levels due to small crop size), except in the area that is more developed (it was transplanted earlier). In the third image, LWS does NOT show stress (except on the paths), it evaluates crop size (NDVI) and its moisture level (NDMI) and rules out stress (LWS).

Report Generator
Why are the ranges shown in the PDF generated by the report generator different from the layer legend in Layers?
The ranges we observe in the PDFs are slightly different from those presented in the layer legend in Layers; this is done to help with visualization.
Currently we work with two color ranges, continuous and discrete. The continuous one creates a gradient color until reaching the corresponding color, giving us that higher resolution effect, and the discrete one, from a fixed value, shows it in a solid color, necessary to create areas in pdf or shp.
Let’s explain an example:

We observe a field, the Vegetative Vigor (NDVI) layer in the upper left image, with its PDF layer just below.
If we observe in discrete colors, both the cuts of the visual layer in Layers and the PDF on a GIS program, downloading the RAW from Layers, we can see that this slight modification of ranges helps make the visual image and the areas in continuous colors more similar, smoothing the optical effect generated with the continuous legend.
In other words, the image with PDF ranges is more similar to the visual one than the one that has been segmented with its ranges.
This has been done in all Layers layers to help with their interpretation.
SAR
Why is there no variation between SAR passes?
It is likely that if you are between two SAR passes with less than 12 days, the same SAR scene will be repeated as shown in the following example.
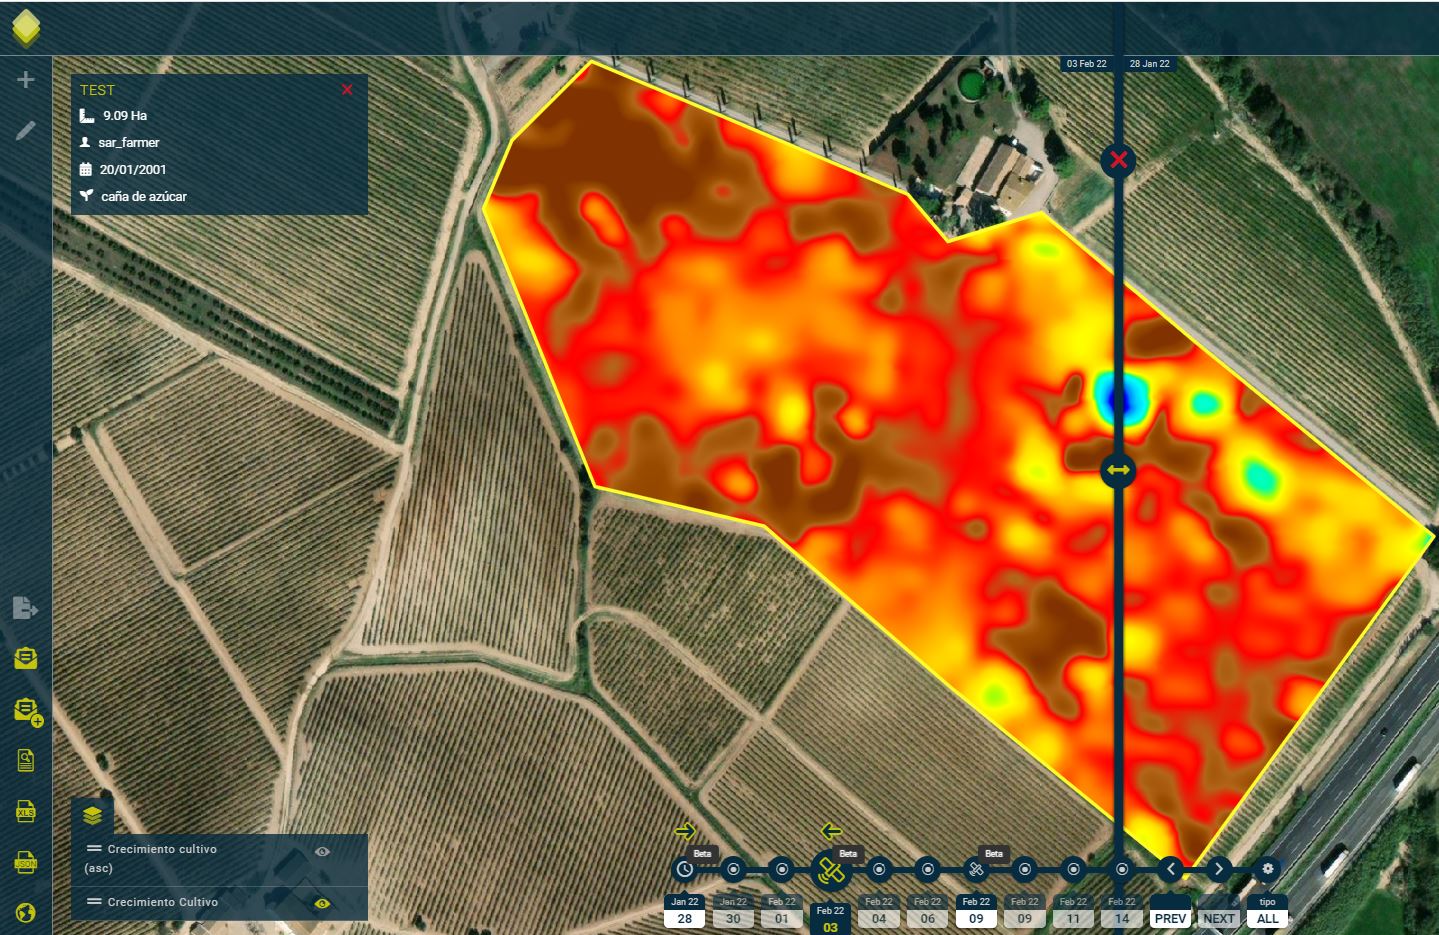
This is because the date where the SAR scene is repeated corresponds to a different orbit than the selected one. In the example case, it’s a descending orbit and February 3rd corresponds to an ascending orbit and shouldn’t appear, that’s why on that day the behavior is to take the previous image and therefore we see it repeated.
This can happen if you are in areas where you have ASCENDING and DESCENDING orbits:

Source: https://sentinels.copernicus.eu/web/sentinel/missions/sentinel-1/observation-scenario
**We are working on a solution to prevent these anomalous behaviors.
Why do we see contrary or unrelated values between SAR and NDVI?
There are three main causes why we can see totally contrary or unrelated SAR and NDVI values:
Rain and water accumulation on bare soil.
Winds over large-sized crops.
Pivot areas, if they are activated at the time of the pass.

Has an empty SAR PDF been generated?
![]()
If you’ve encountered this situation, it’s because the date selected for generating the PDF layer is on a “repeated” SAR scene due to the anomaly explained in the following FAQ: Why is there no variation between SAR passes?
This can happen if we’re between two SAR passes with less than 12 days of recurrence. In this example, we see that we have the same SAR image for the dates 01/28/2022 and 02/03/2022.
If we generate the PDF with the date where the SAR scene is repeated (02/03/2022), it will return an empty PDF because that day the SAR scene shouldn’t actually appear.
If we select PDF generation for the date 01/28/2022, the PDF will appear:

**This also applies to the shp
**We are working on a solution to prevent these anomalous behaviors.
Dashboard
Satellite
Why do I have values of 0 in the satellite statistics?
Whenever the cloud percentage exceeds 80% for that date and that specific plot, the statistics are marked as 0.
Drone
When I try to view information for SUGARCANE or SOYBEAN in Dashboard and NITROGEN and RELATIVE NITROGEN appear, what does each graph refer to?
The relative nitrogen graph refers to the nitrogen content in leaves that is measured through the drone flight. The nitrogen graph shows the nitrogen content in leaves captured through the drone flight and corrected with the foliar samples that have been taken.